SOL Chart Note, Oct 19: Short State, 1H Trend Line $109.00
SOLUSDT.P trades at $104.18 after a $100.35 to $104.75 session. The Pullwave indicator is in a short state with its 1H trend line at $109.00.
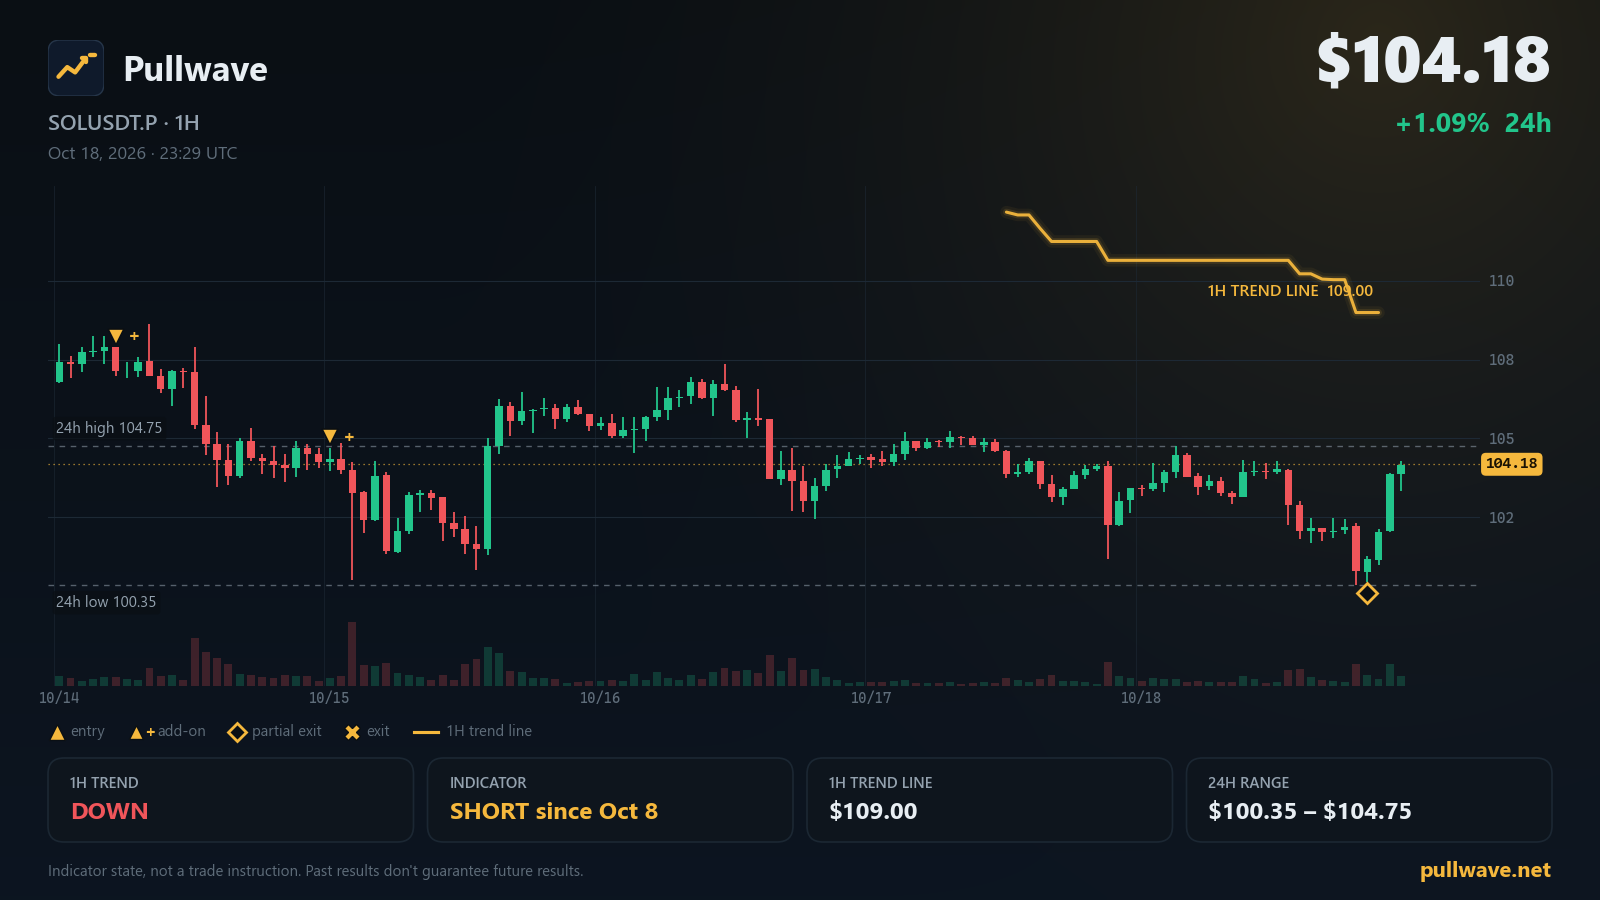
Key levels
- 7-day high113.38
- Indicator 1H trend line109.00A 1H close beyond this line flips the indicator's 1H trend filter.
- 24h high104.75
- 24h low100.35
- 1H trend
- Down
- Indicator position
- Short since Oct 8
- Last indicator event
- Partial exit (short) · 100.77 · Oct 18
- 1H trend line
- 109.00
SOL spent another session inside a tight band, and the Pullwave CYH Pullback Strategy is still carrying the same directional read it has held for more than a week. Below is the state of the chart as of this morning, 19 October 2026, on the SOL USDⓈ-margined perpetual futures market (SOLUSDT.P). Everything here is a description of what the indicator is showing, not advice about what to do with it.
Market snapshot
SOLUSDT.P last traded at $104.18, up 1.09% over 24 hours. The session range ran from a low of $100.35 to a high of $104.75, which means the low of the day is also the low of the week: the 7-day low is $100.35, while the 7-day high sits further above at $113.38.
Positioning data is quiet rather than stretched. The latest funding rate is about 0%, essentially neutral, so neither side of the book is paying meaningfully to hold exposure. Open interest stands at 8,948,197 SOL, roughly $933M, and changed by +1.81% over 24 hours — a small build rather than a flush or a surge.
On the network side, status.solana.com reports All Systems Operational.
What the Pullwave indicator shows
The Pullwave CYH Pullback Strategy runs on 30m and 15m SOLUSDT.P charts, and it is built from fixed price-and-volume rules — no machine learning, no discretion. Two pieces do the work.
The first is the 1H trend filter. This is a volatility-based trailing line plotted from 1-hour data. It sits above price when the filter is in a down state and below price when it is in an up state, and it only changes side when a 1H candle closes through it. That single line is what decides which direction the strategy is allowed to look for setups in. Right now the 1H trend filter is DOWN, and the trend line itself is at $109.00. If a 1H candle closed above $109.00, the trend filter would flip to UP.
The second piece is 15m execution. Inside an established trend, the indicator waits for price to pull back against the move, then marks an entry on the 15m chart when its conditions line up. If the trend continues and price pulls back again, the indicator can print an add-on entry — a second marker in the same direction, tracked in the add-on conditions table on the chart. When a move extends far enough, it prints a partial exit instead, which reduces rather than closes the marked position. The indicator draws these events and can fire alerts; the user places any orders themselves.
As of this morning, the indicator's position state is short, dated back to Oct 8, 11:00 UTC. The most recent event on the chart is a partial exit on the short, printed at Oct 18, 20:00 UTC near $100.77 — in other words, it registered that the down move had extended into the lower end of the recent range and scaled the marked position there.
Key levels on the chart
- $113.38 — 7-day high
- $109.00 — Indicator 1H trend line
- $104.75 — 24h high
- $100.35 — 24h low
Solana ecosystem and official updates
Firedancer Mainnet Release v26.10.2 — 14 October 2026. Firedancer v26.10.2 is a mainnet-ready release adding Alpenglow support (enabled by default on testnet and devnet), support for all Solana 4.3 features, reduced mainnet memory usage from 183 to 159 GiB, and faster snapshot loading down to 40 seconds. Source: Firedancer (GitHub).
Release v4.3.2 — 15 October 2026. Agave v4.3.2 is a stable release suitable for Testnet, Devnet and Mainnet Beta, including CI fixes, a pinned cargo-build-sbf and spl-token-cli version, and a bump to the max supported transaction version in ledger-tool. Source: Anza Agave (GitHub).
Geo-Aware Leader Schedule — 14 October 2026. A study on SIMD-0675 proposes a geo-aware leader schedule that reorders Solana's stake-weighted schedule so consecutive leaders are geographically close, cutting handoff latency without changing any validator's number of leader windows. It recommends STAKE_FLOOR around 10% and RUN_LENGTH between 3 and 7. Source: solana.com.
More Breakpoint 2026 Speakers Confirmed for London — 12 October 2026. Twelve more speakers join Breakpoint 2026 at Olympia London, 15-17 November, including leaders from Backpack, Sunrise, Zelle, Bitwise, Y Combinator, Jupiter and Helius. Source: solana.com.
What to watch next
A few conditional observations, framed only around the levels listed above.
The level that changes the indicator's framework is $109.00. While 1H candles keep closing below it, the trend filter stays DOWN and the strategy keeps looking for short-side pullback setups only. If a 1H candle closes above $109.00, the trend filter would flip to UP, and the indicator's short state would no longer be supported by its own filter.
Between here and there, $104.75 is the nearest reference point overhead as the 24h high, with $113.38 — the 7-day high — the furthest marker on the chart. Below, $100.35 is doing double duty as both the 24h low and the 7-day low; a 15m or 1H close under it would mean price is trading beneath every level on today's list, while repeated defences of it would keep the recent range intact.
Also worth noting as context, not as a signal: funding near 0% and a +1.81% open interest change describe a market that is adding exposure slowly rather than leaning hard one way. If the indicator prints a further add-on entry or another partial exit, it will appear on the 15m chart with the add-on conditions table updated alongside it.